Read resilience as a managed organizational capability, not just as a risk list.
Within EENTOOLS, the Resilience Assessment Tool helps teams understand how prepared, exposed, and recoverable the organization really is across governance, operations, finance, and external context.

It measures resilience through four core capability areas
The assessment goes beyond incident response. It reviews how well the organization is prepared before disruption, how well it continues during pressure, and how well it recovers afterwards.
-
Organizational preparedness
Measures governance, ownership, coordination, and decision discipline under uncertainty or disruption.
-
Operational continuity
Shows whether essential processes can continue under stress and whether fallback logic actually exists.
-
Financial resilience
Reviews liquidity, cost flexibility, and the ability to remain viable under pressure.
-
Adaptation to external context
Helps teams understand how supply, environmental shifts, and external shocks affect resilience capacity.
Decision-ready outputs for management and delivery teams
The results make it easier to see where capability is stronger, where investment is urgent, and how to structure the next improvement roadmap.
Maturity overview
A concise summary of stronger and weaker resilience dimensions in one management-ready view.
Comparable structure
Supports more consistent benchmarking across periods, teams, or program participants.
Prioritized gaps
Highlights which weaknesses deserve earlier intervention from an operational impact perspective.
Roadmap input
Feeds directly into capability-building plans, investment sequencing, and action prioritization.
Radar, report, and category views in one EENTOOLS flow
The resilience landing logic is reinterpreted here in the EENTOOLS design language, with amber accents and explicit dark/light mode behavior.
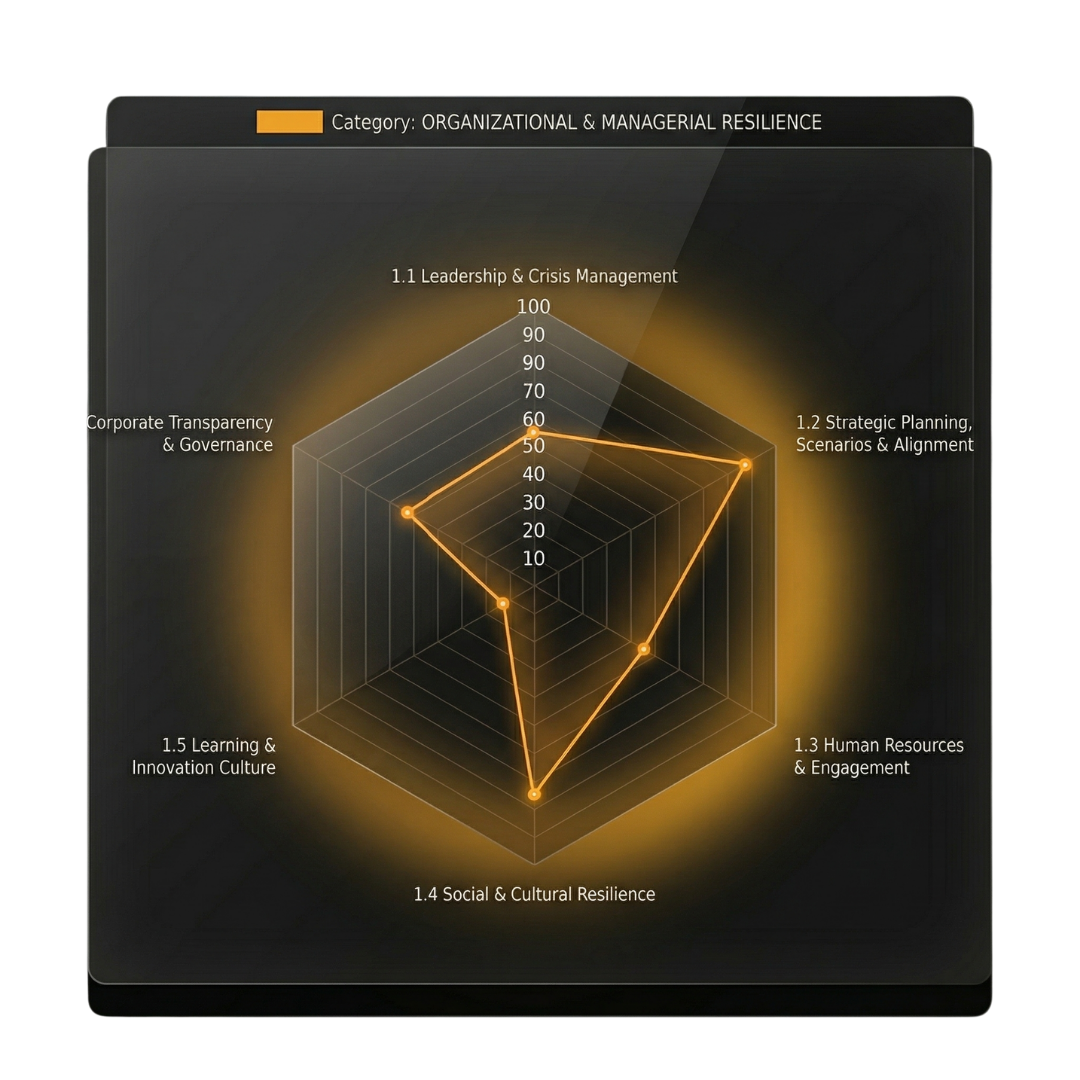
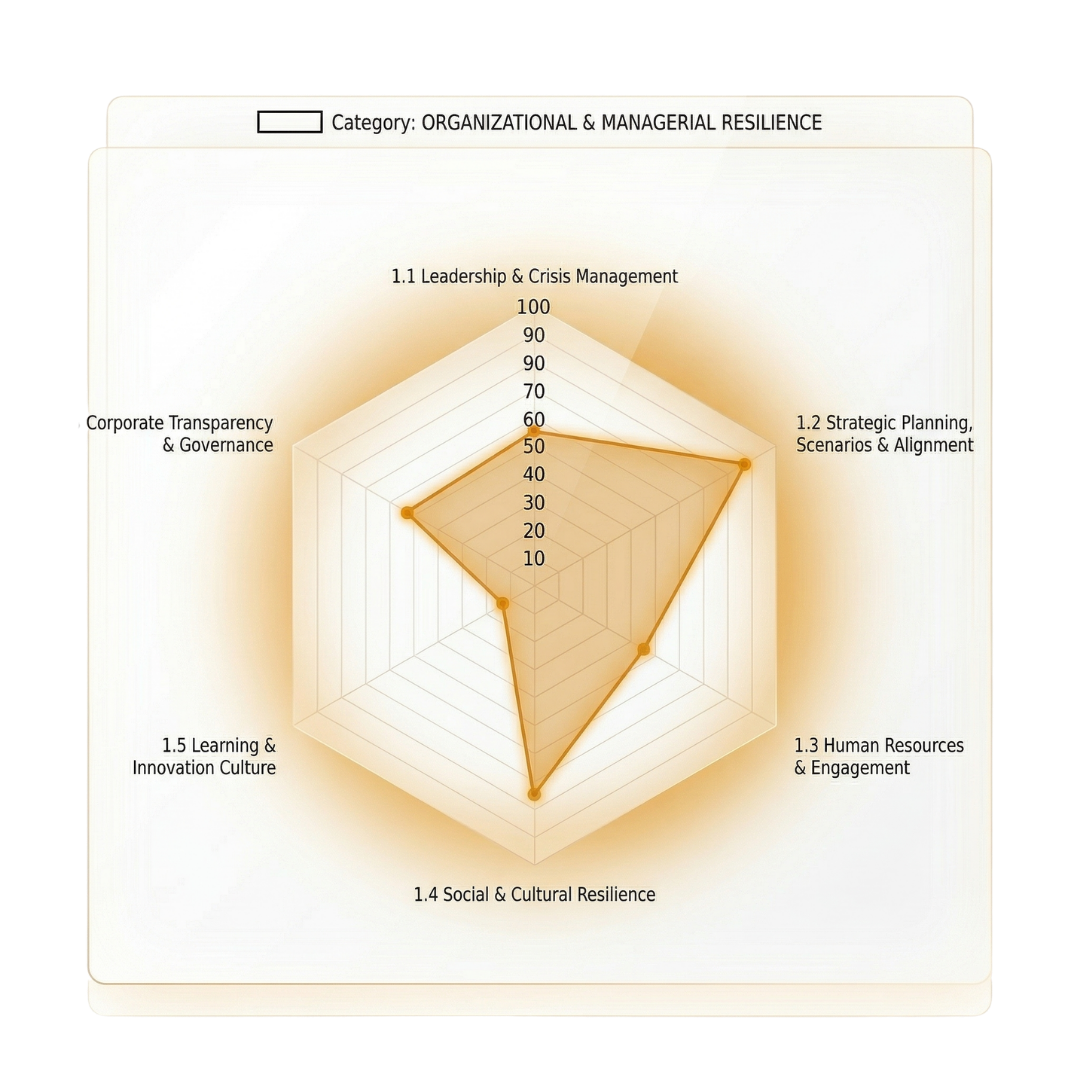
Radar view
Shows balance and imbalance across resilience dimensions in one visual frame.
Report export
Produces a report-ready output that can support management review and external reporting.
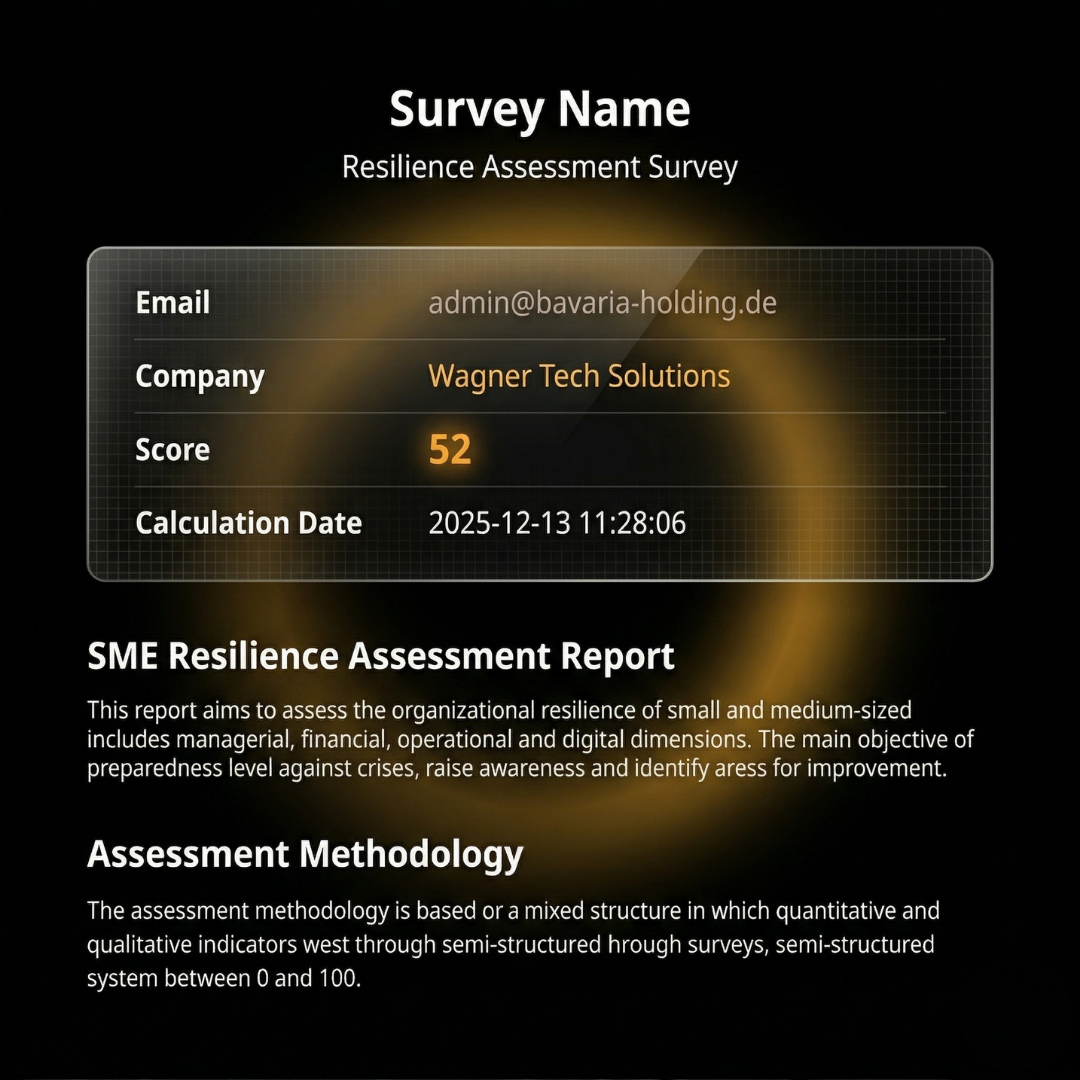
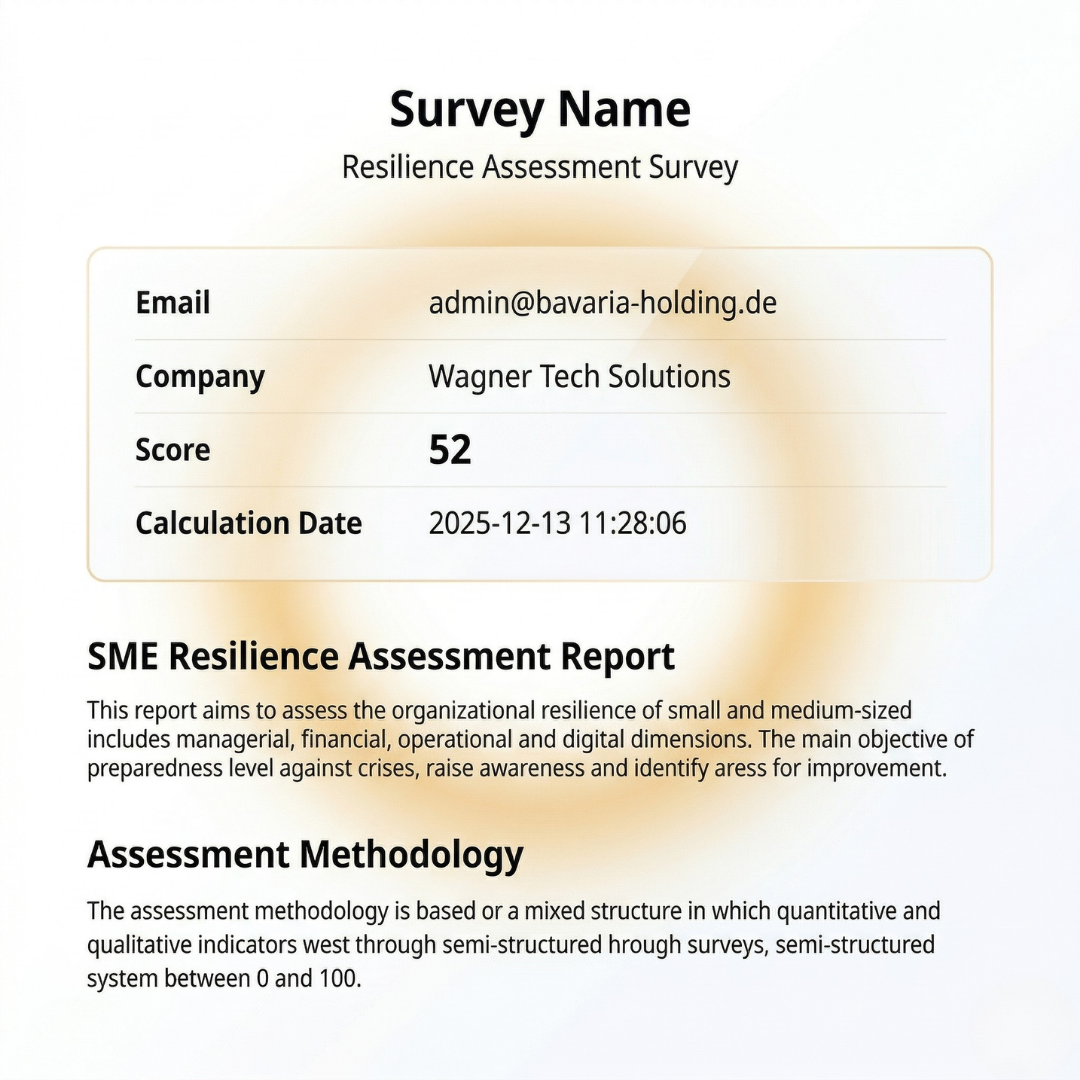
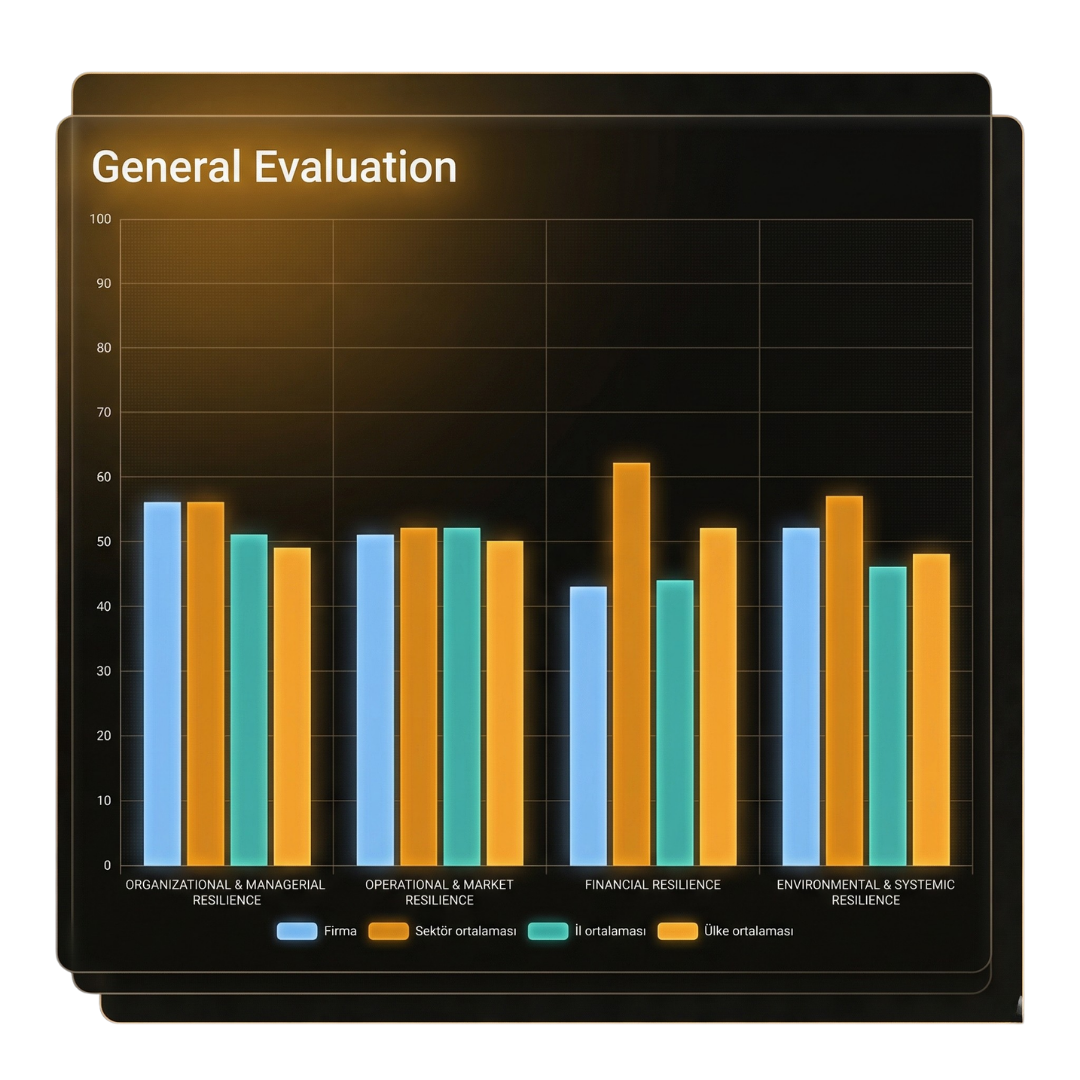
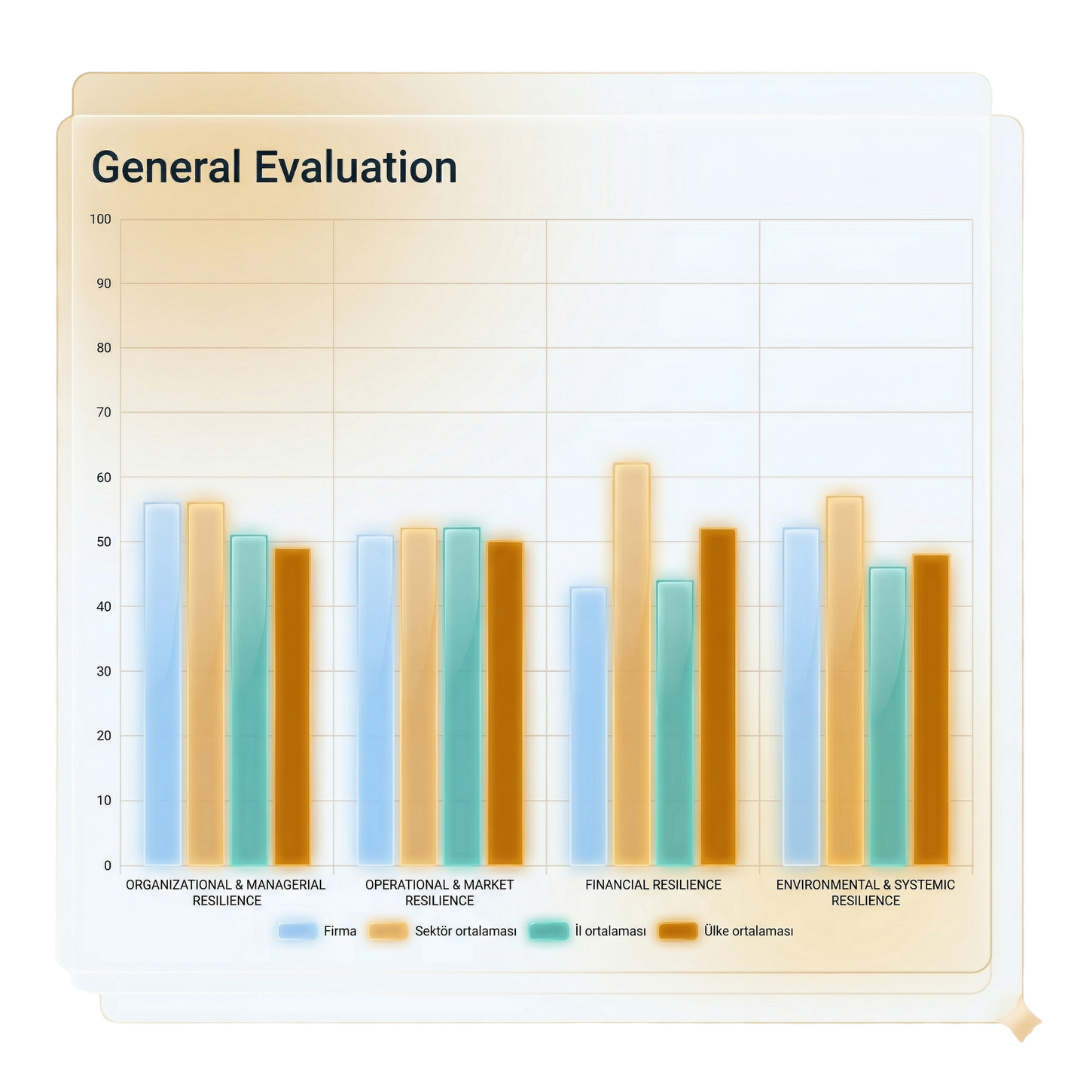
General evaluation
Combines headline scoring, level reading, and interpretation in a single overview screen.
Category analysis
Lets teams read capability and exposure differences in more detail by dimension.
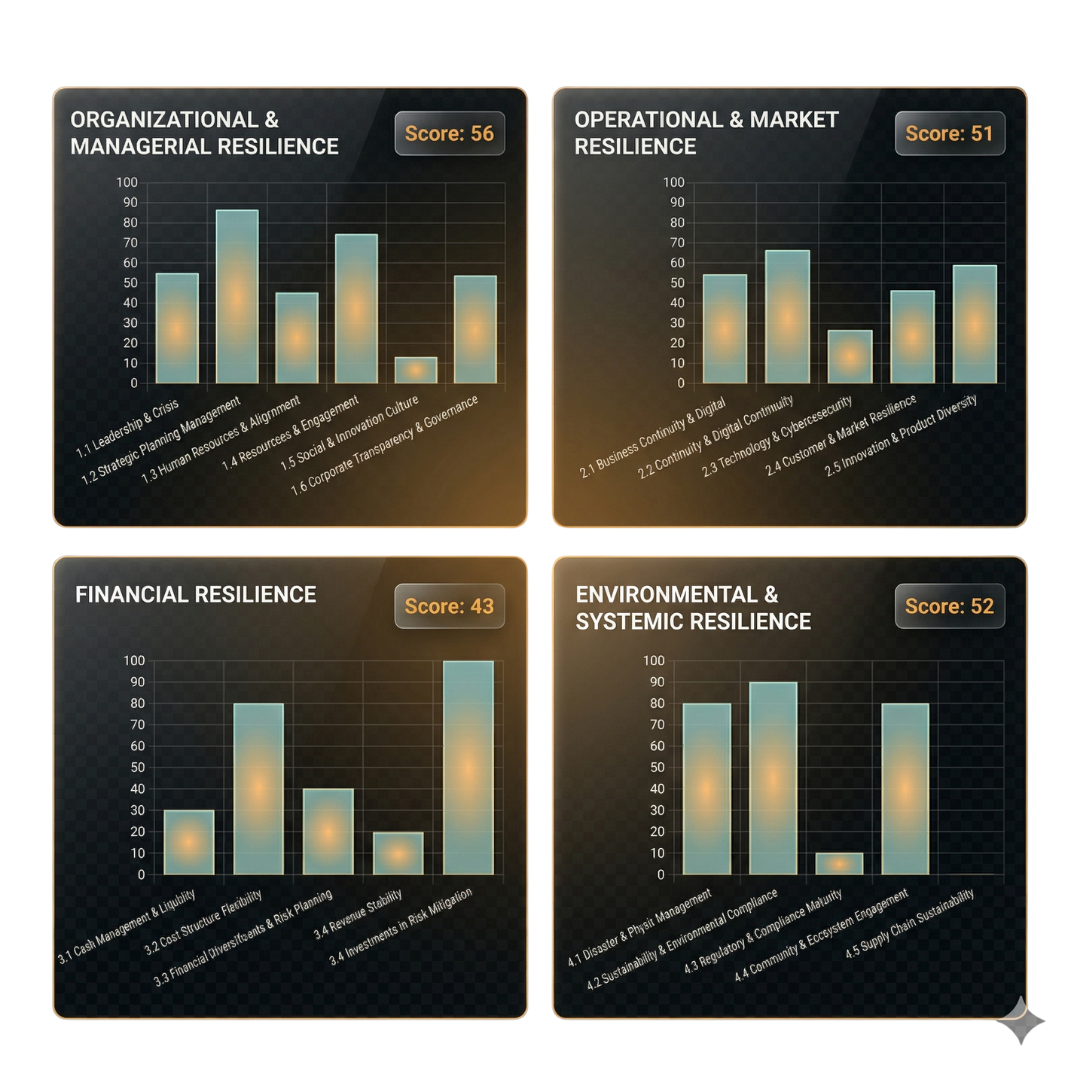
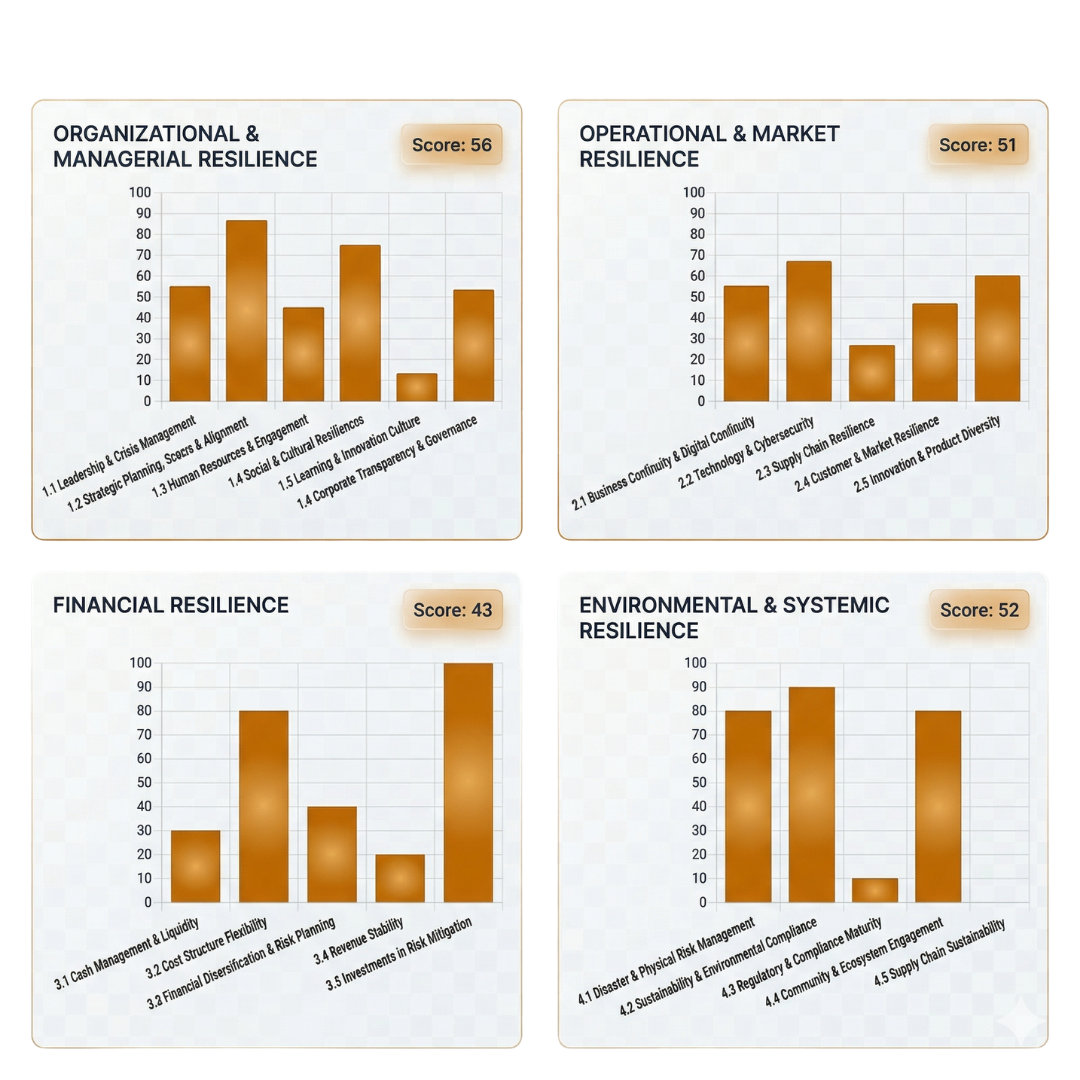
Resilience assessment category and subcategory map
This block shows the real hierarchy defined in the Resilience Survey fixture, so the landing page reflects the full assessment structure across organizational, operational, financial, and environmental resilience.
ORGANIZATIONAL & MANAGERIAL RESILIENCE
- 1.1 Leadership & Crisis Management
- 1.2 Strategic Planning, Scenarios & Alignment
- 1.3 Human Resources & Engagement
- 1.4 Social & Cultural Resilience
- 1.5 Learning & Innovation Culture
- 1.6 Corporate Transparency & Governance
OPERATIONAL & MARKET RESILIENCE
- 2.1 Business Continuity & Digital Continuity
- 2.2 Technology & Cybersecurity
- 2.3 Supply Chain Resilience
- 2.4 Customer & Market Resilience
- 2.5 Innovation & Product Diversity
FINANCIAL RESILIENCE
- 3.1 Cash Management & Liquidity
- 3.2 Cost Structure Flexibility
- 3.3 Financial Diversification & Risk Planning
- 3.4 Revenue Stability
- 3.5 Investments in Risk Mitigation
ENVIRONMENTAL & SYSTEMIC RESILIENCE
- 4.1 Disaster & Physical Risk Management
- 4.2 Sustainability & Environmental Compliance
- 4.3 Regulatory & Compliance Maturity
- 4.4 Community & Ecosystem Engagement
- 4.5 Supply Chain Sustainability
Capture the current state, read the gaps, sequence the next steps
Once the structured assessment is completed, EENTOOLS turns the answers into outputs that can be compared, interpreted, and acted on more easily.
1. Capture the current practice
Document preparedness, continuity, financial resilience, and external-context responses through a structured set of questions.
2. Read the scores and gaps
The platform surfaces resilience levels, stronger areas, and the capability gaps that matter most.
3. Clarify the roadmap
Turn the output into improvement priorities, investment choices, and capability-building actions.
Suitable for SMEs, support programs, and advisory teams
Especially useful for teams that need a systematic view of resilience gaps, program-level comparison, and a stronger basis for action planning.
-
SME leadership teams
Useful for organizations that need to know which resilience capabilities should be strengthened first.
-
Support and funding programs
Well suited for structures that need a common method to compare preparedness across many companies.
-
Advisors and project leads
Helpful for professionals who need to convert findings into reports and practical action plans.
Common questions
Read adjacent decision areas together
Resilience capability becomes much more useful when reviewed together with RECAP, scenario analysis, and digital maturity signals.
See resilience gaps before they become costly
Measure preparedness, separate the most important weaknesses from the rest, and base the improvement roadmap on a clearer capability view.