Bring exposure and capability into the same decision view.
RECAP does more than return a single score. It helps teams read residual exposure, resilience level, RME, and capability index together so decisions are easier to defend and compare.
It reads exposure and capability together
The model separates exposure from resilience capacity so teams can see not only how much pressure exists, but how prepared the organization is under that pressure.
-
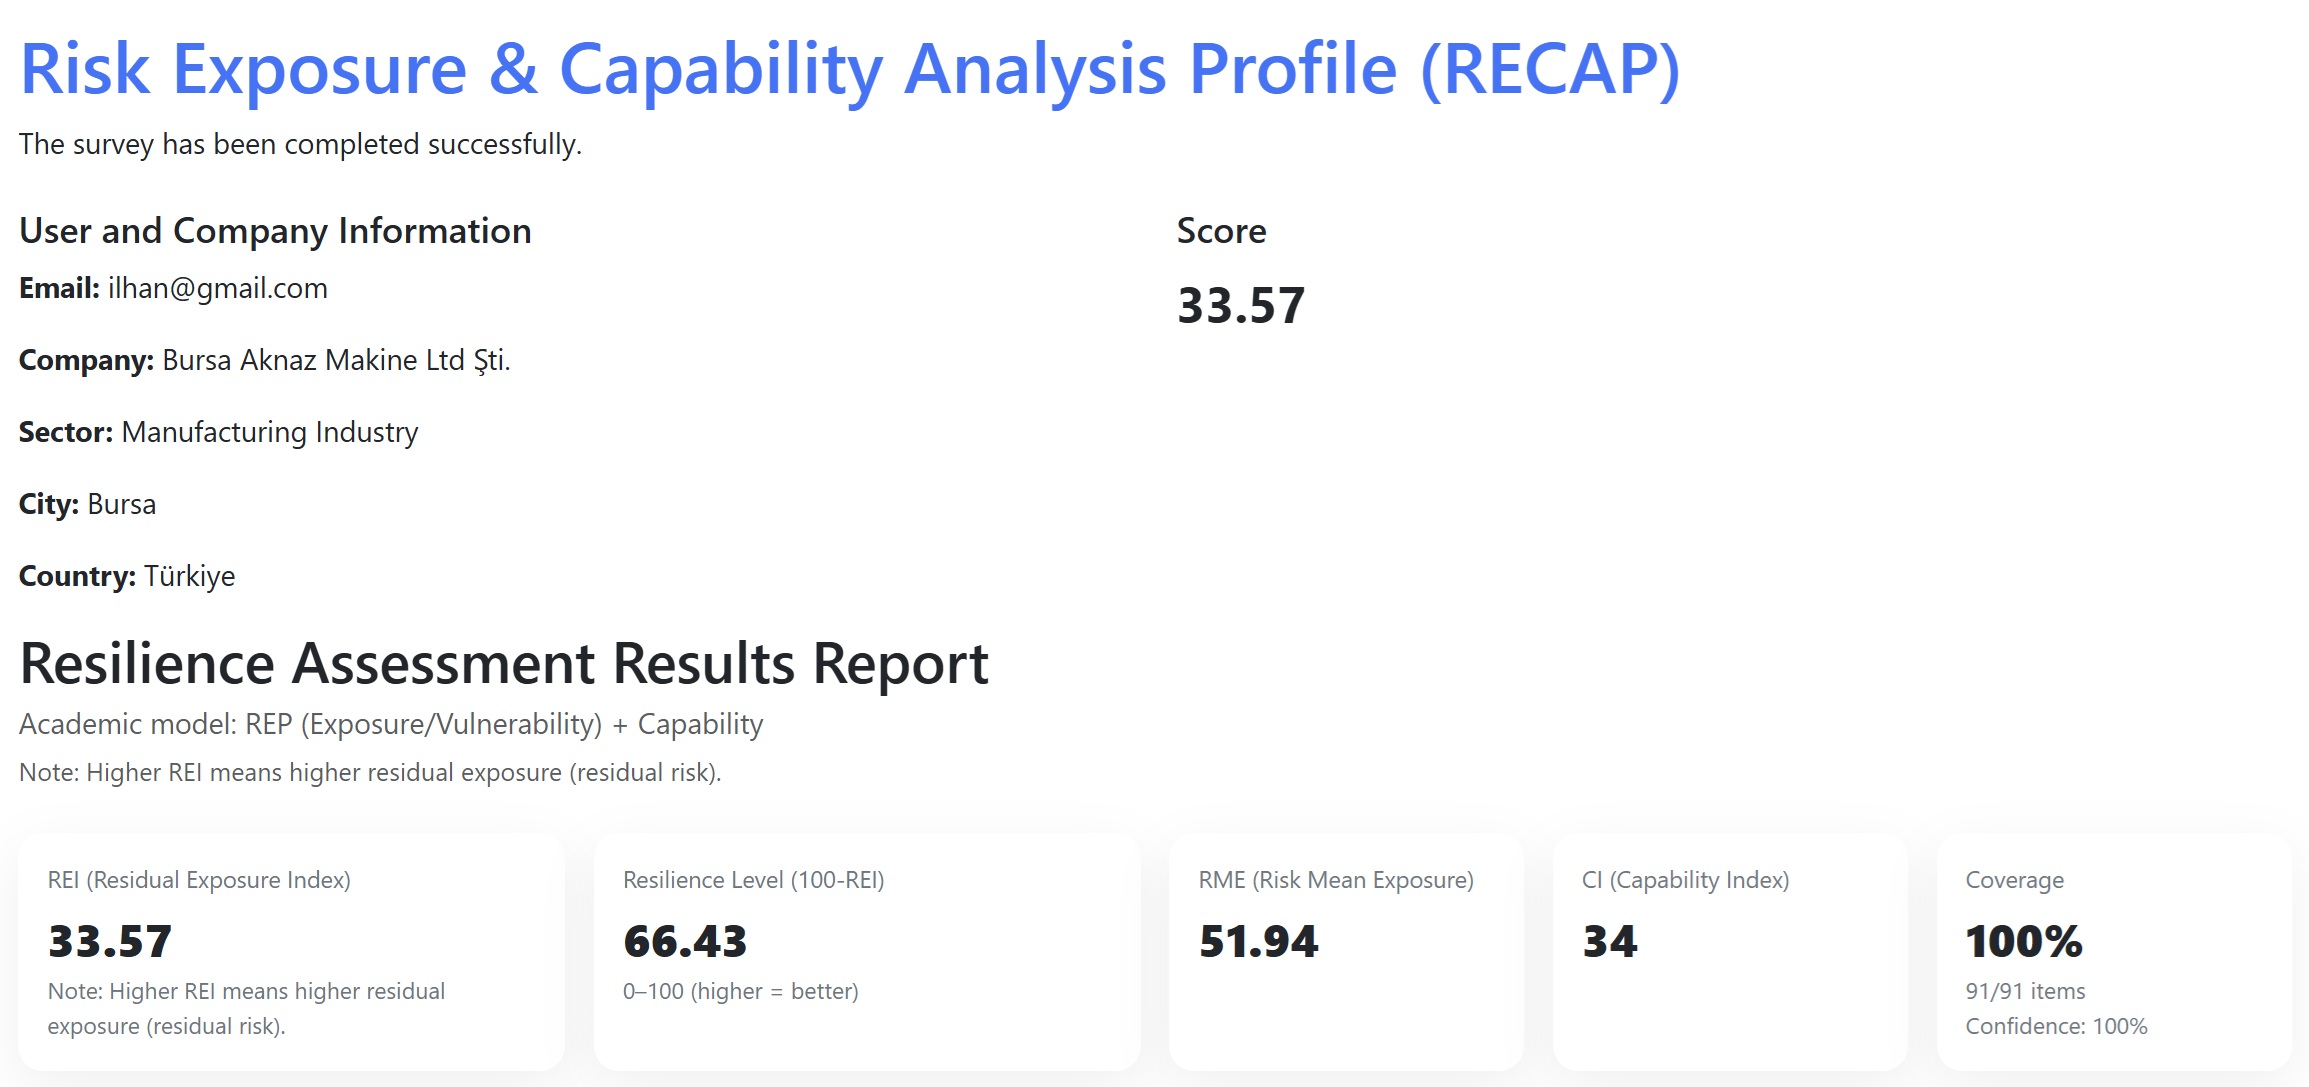
Residual Exposure
Shows how much pressure the organization remains under once the risk environment is taken into account.
-
Resilience Level
Provides a complementary layer that helps teams see how much balancing capacity exists alongside that exposure.
-
RME and Capability Index
Separates risk-management effectiveness from broader capability so interpretation becomes more useful.
-
Coverage and confidence
Makes it easier to judge how robust the result is by surfacing response coverage and confidence indicators.
Model-based outputs that support comparison
RECAP helps managers, advisors, and program operators compare organizations more consistently and prioritize action more clearly.
Executive summary
Presents REI, resilience level, RME, and confidence in one quick management-ready overview.
Benchmark matrices
Produces visuals that support more systematic comparison across organizations or time periods.
Action-oriented reading
Moves beyond score display to show which areas should be addressed first.
Report-ready structure
Supports presentations, program monitoring, and stakeholder reporting in a more consistent way.
RECAP outputs reworked into the EENTOOLS design language
The core RECAP landing content is preserved here, but restyled inside EENTOOLS with amber accents and explicit dark/light mode support.
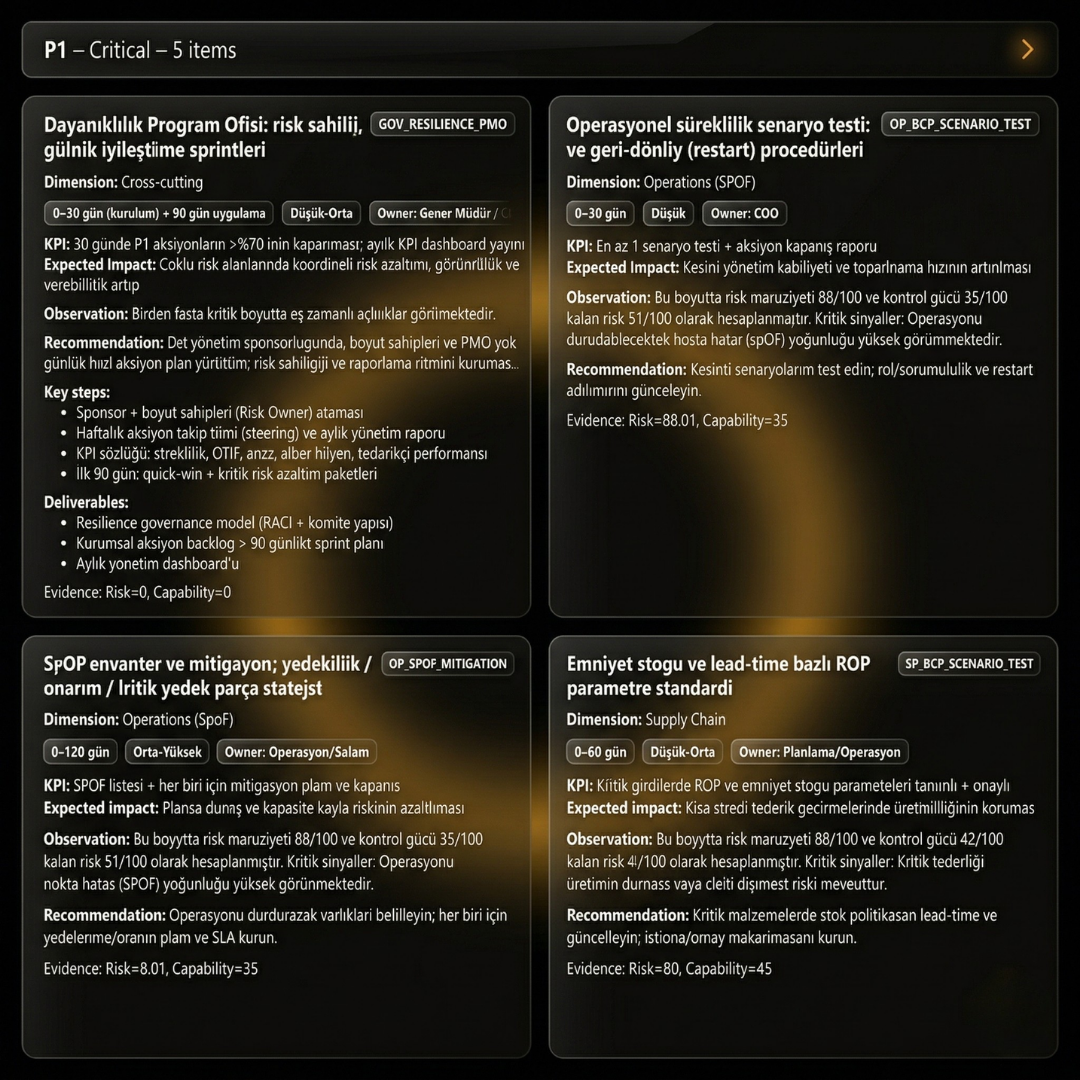
Action plan output
Connects findings to implementation-oriented improvement themes.
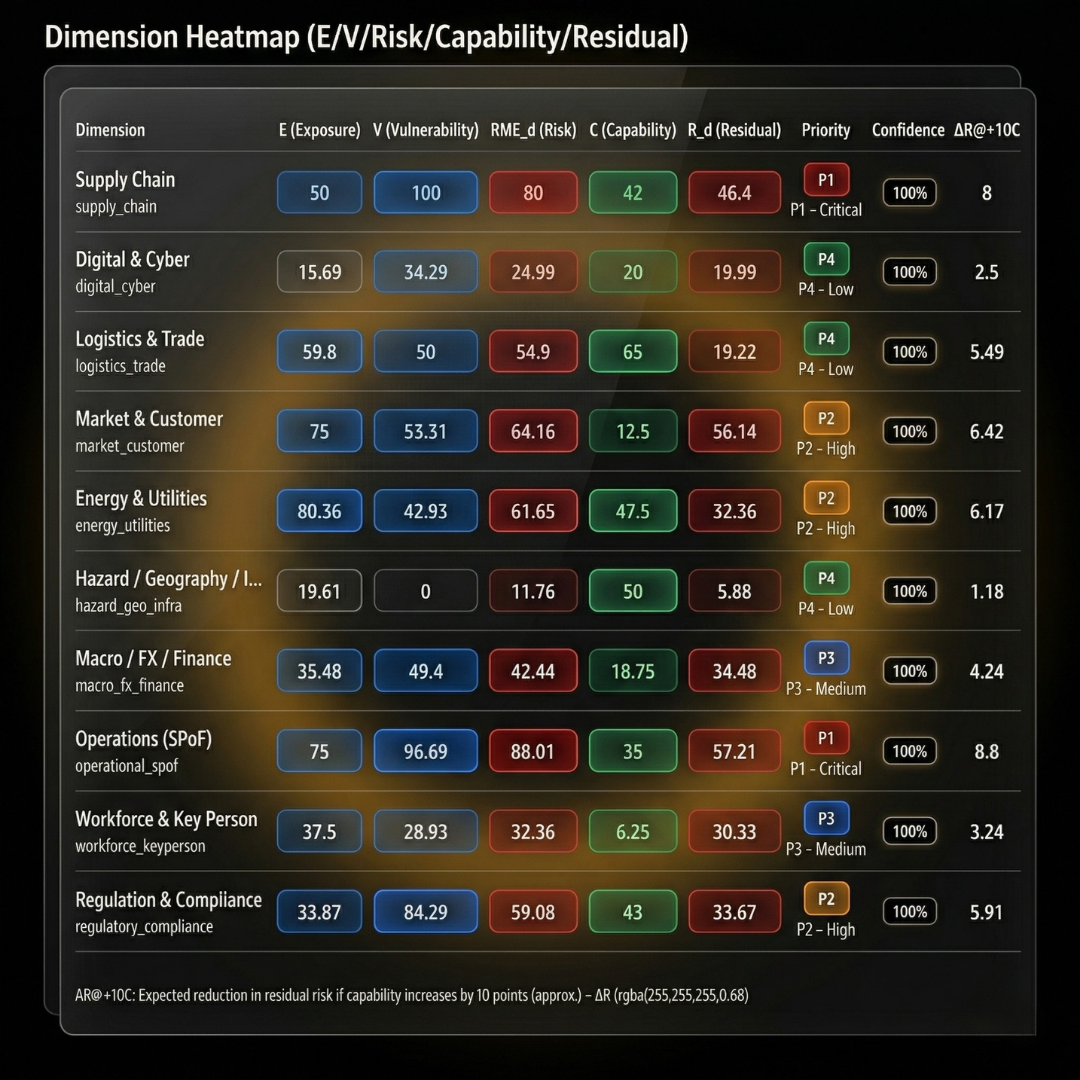
Heatmap view
Helps teams interpret concentrated exposure and capability patterns more quickly.
It is designed to explain the structure, not just the score
Once the response set is complete, the platform separates exposure, resilience, and capability logic and turns the result into benchmark-ready outputs.
1. Complete the assessment
Capture the required inputs through a structured response flow and clarify the coverage level.
2. Read the layered output
Interpret REI, resilience level, RME, and capability index together instead of relying on a single headline number.
3. Build action and benchmark logic
Use the results both for comparison and for prioritizing the next practical improvements.
Built for teams doing comparative assessment
Especially useful for program operators, consultants, and teams that review many organizations through a common model.
-
Program operators
Useful for teams that need a common method to track exposure and capability across many companies.
-
Consultants and analysts
Helps professionals make assessments more analytical, comparable, and easier to explain to clients or stakeholders.
-
Internal decision-makers
Suitable for management teams that want to read risk pressure and capability together instead of relying on a single score.
Common questions
Read RECAP together with other decision tools
RECAP becomes even more useful when reviewed next to resilience, sustainability, and scenario-analysis outputs.
Clarify exposure and capability with RECAP
See risk exposure, confidence, and benchmark structure inside one platform and connect the output to a more actionable interpretation logic.